
Build the view your managers actually need and have it land in their inbox. Describe a report in plain words and it's built for you, put your reports together on one dashboard and get that dashboard emailed to your team on a schedule.
Where to find it: in the Kixie AI Dashboard, click Reports, then the Boards tab. Create a dashboard, add reports and click Schedule to have it emailed.
This article includes a video tour and four short animations. Names, email addresses and call totals are blurred.
Watch the 90-second tour
What you get
- Reports. A report is one measure of your business, such as answer rate by rep, a leaderboard or a call trend. On a dashboard, each report appears as a tile.
- Dashboards. A dashboard is a collection of reports on one page. You'll find them on the Boards tab. Build one around the way your team works, such as "Weekly SDR connect rates."
- Reports you describe in plain words. Type what you want to see and the report is drafted for you, or pick from a library of ready reports: key stats, call trends, leaderboards, sentiment, objections and competitors, PowerDialer lists, pivot tables, call and SMS history, and more.
- Control over what each report counts. Narrow any report by call source, direction, disposition, business hours, reps or teams, and pin it to its own date range.
- Your dashboard in your inbox. Have any dashboard emailed daily, weekly or monthly, with its own send time, time zone, recipients and date range, or send its data to another system by webhook.
Dashboards are shared: everyone with access to Reports in your business sees the dashboards you save. Each business can have up to 40.
Which one should I use? Build a dashboard when you want your own reports, filters and layout, a monthly email or a webhook. For a fixed-format recap with coaching sections like Wins and Calls to review, use the structured report builder.
In this article
- Get a quick answer in the chat
- Build a dashboard around your questions
- Add reports from the library
- Make every report answer the right question
- Compare a period against your baseline
- Arrange the dashboard to read your way
- Get your dashboard by email
- Send your dashboard to another system
- Check the email before and after it sends
- Rename or delete a dashboard
- Quick tips
- Troubleshooting
1. Get a quick answer in the chat
For a one-off question, you don't need a dashboard.
- Click in the chat box at the bottom of any screen.
- Describe the report the way you would ask an analyst. Name the time period and the people, for example "connect rate by rep for last week, outbound only."
- Press Enter. The answer comes back as text, a table, a chart or a CSV download.
To keep a report and see it again tomorrow, put it on a dashboard.
2. Build a dashboard around your questions
- In Reports, click Boards, then Create board, or open Blank board.
- Name it for what it shows, for example "Weekly SDR connect rates."
- Click Edit board.
- In Describe a tile, type the report you want in plain English. For example: calls over 2 minutes by rep and disposition, business hours only.
- Click Generate tile. The report is drafted for you to review.
- Click Save board. Nothing changes until you save.
Animation: Describe a tile in plain English (14 seconds, loops)
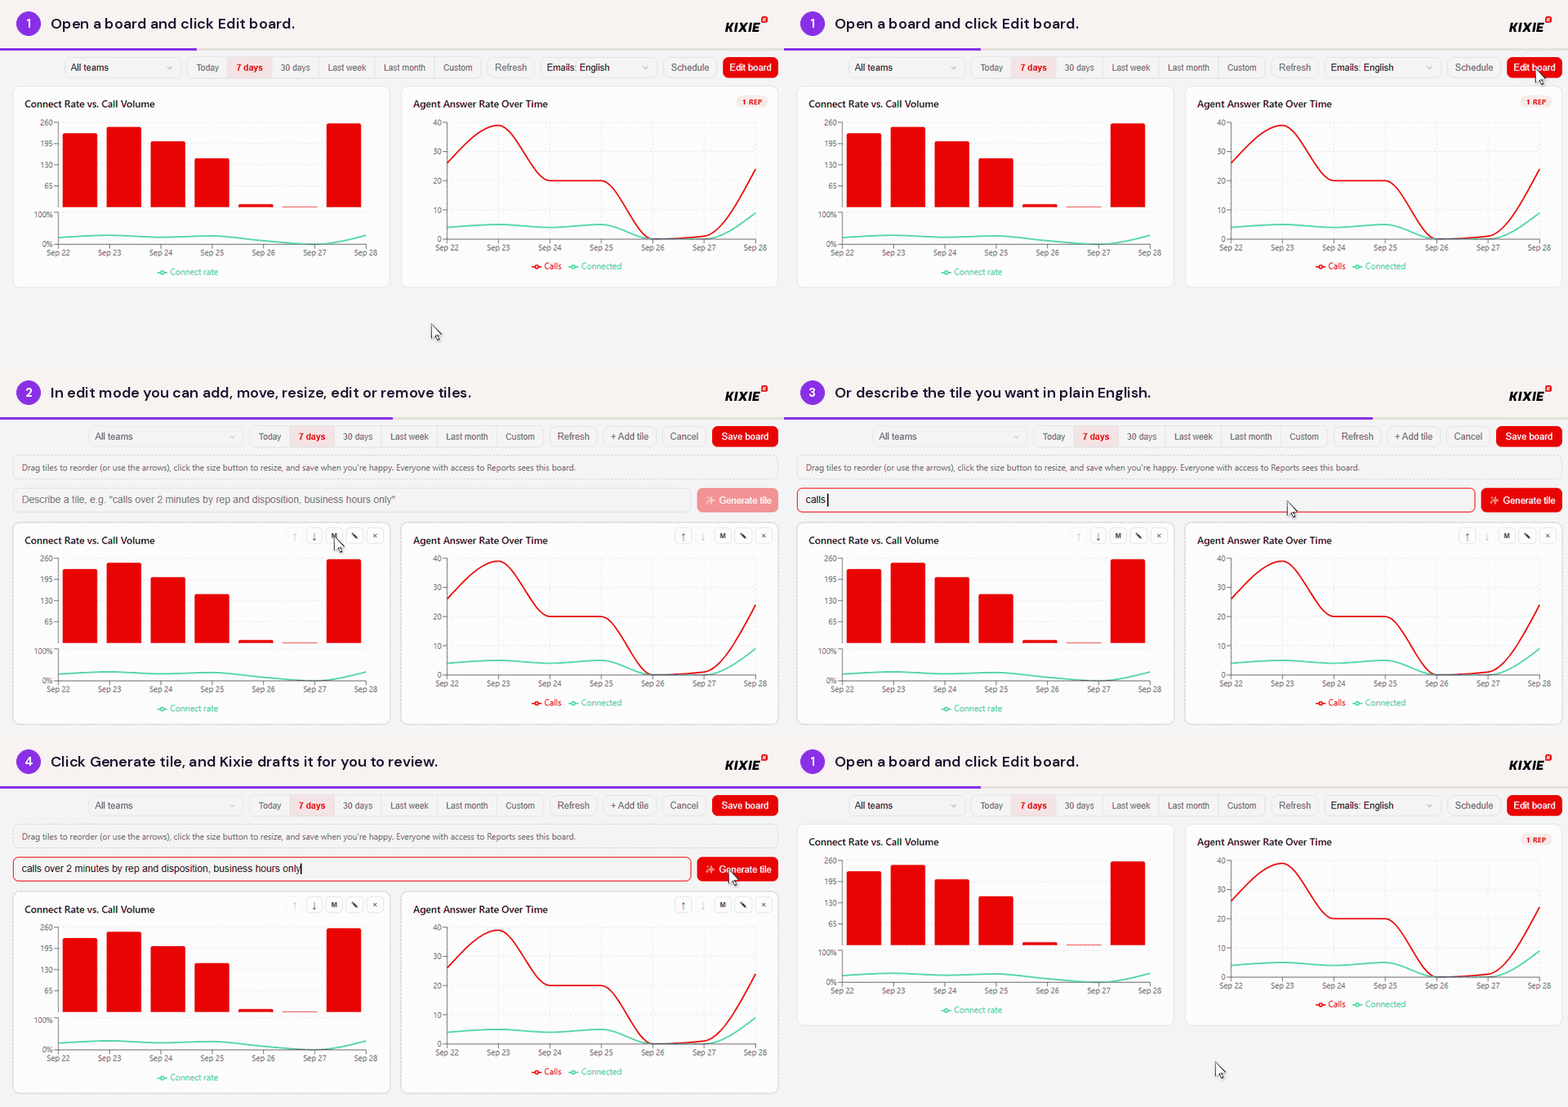
- Open a dashboard and click Edit board.
- In edit mode you can add, move, resize, edit or remove tiles.
- Or describe the tile you want in plain English.
- Click Generate tile, and it's drafted for you to review.
3. Add reports from the library
- On your dashboard, click Edit board, then + Add tile.
- Click Add on the report you want, such as Key stats, Leaderboard, Sentiment or Pivot table.
- Click the pencil on any tile to open its settings, then Done.
Animation: Browse the tile library and tile settings (15 seconds, loops)
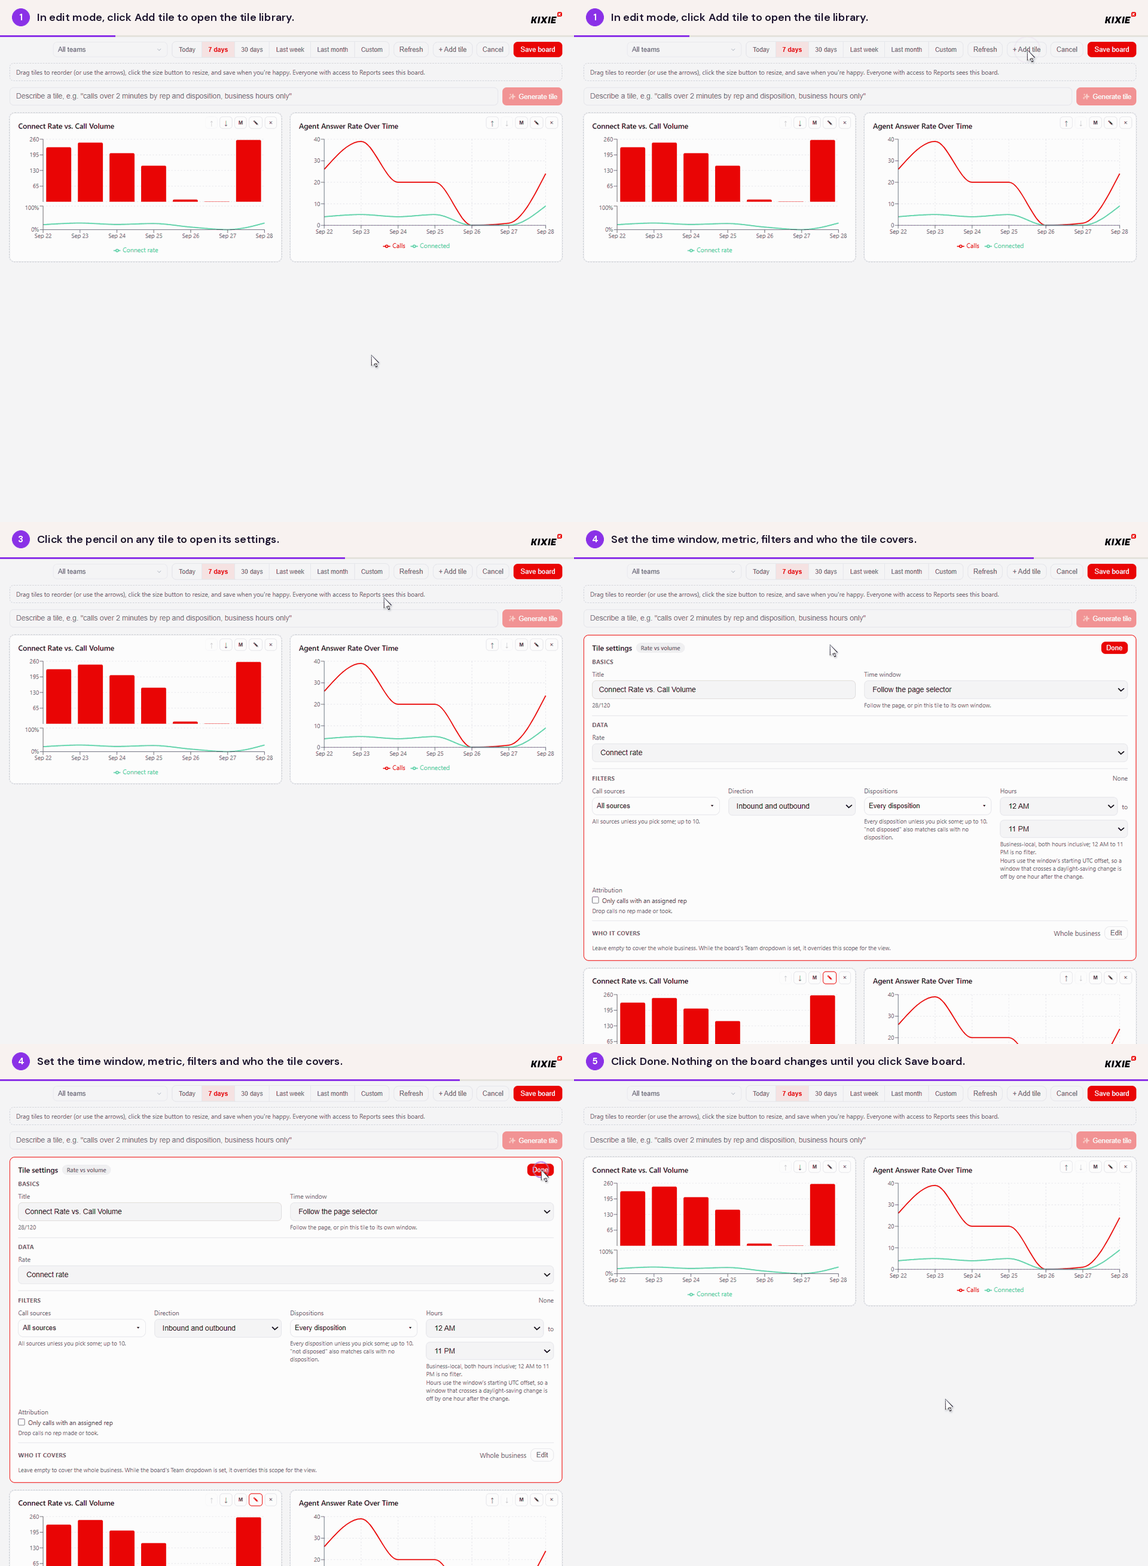
- In edit mode, click Add tile to open the tile library.
- Pick from ready-made tiles for stats, trends, leaderboards, tables and more.
- Click the pencil on any tile to open its settings.
- Set the time window, metric, filters and who the tile covers.
- Click Done. Nothing on the dashboard changes until you click Save board.
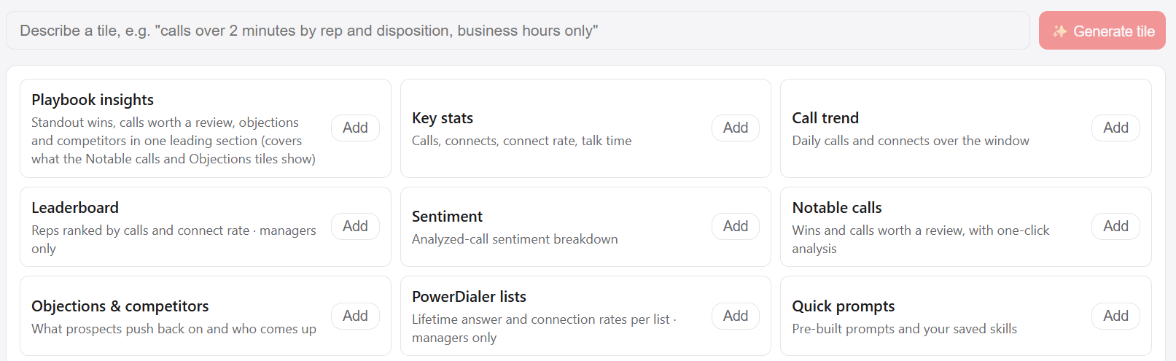
The tile library. Reports marked "managers only" are visible to admins and managers.
4. Make every report answer the right question
In edit mode, click the pencil on a report to open its Tile settings:
- Time window: follow the dashboard's date range, or pin the report to its own window.
- Data: the metric, such as connect rate or answer rate.
- Call sources: all sources, or up to 10, such as PowerDialer calls only.
- Direction: inbound and outbound, inbound only or outbound only.
- Dispositions: every disposition, or up to 10.
- Hours: for example 9 AM to 5 PM, in your business time zone.
- Attribution: tick Only calls with an assigned rep.
- Who it covers: click Edit to pick teams or reps. Leave it as Whole business for everyone.
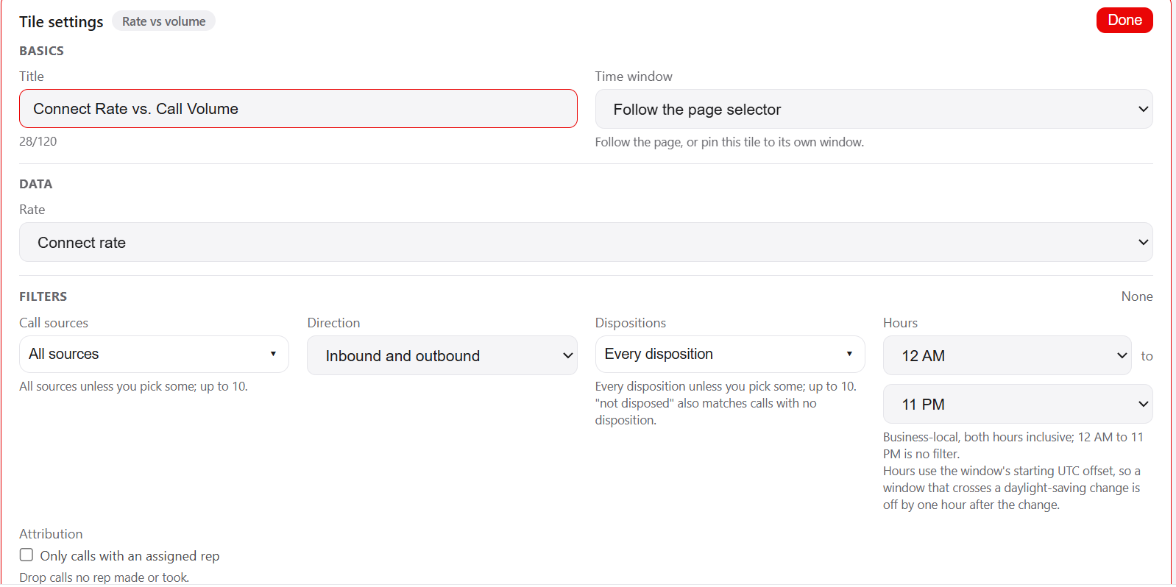
Tile settings: time window, metric and filters.
Good to know: when you pick a team in the dashboard's team dropdown, that team applies to every report while it is selected.
5. Compare a period against your baseline
- Open a report's Tile settings.
- Change Time window from Follow the page selector to Today, 7 days, 30 days, Last week or Last month.
- Click Done. The report shows its own window and ignores the date picker.
Animation: Pin a tile to its own time window (15 seconds, loops)
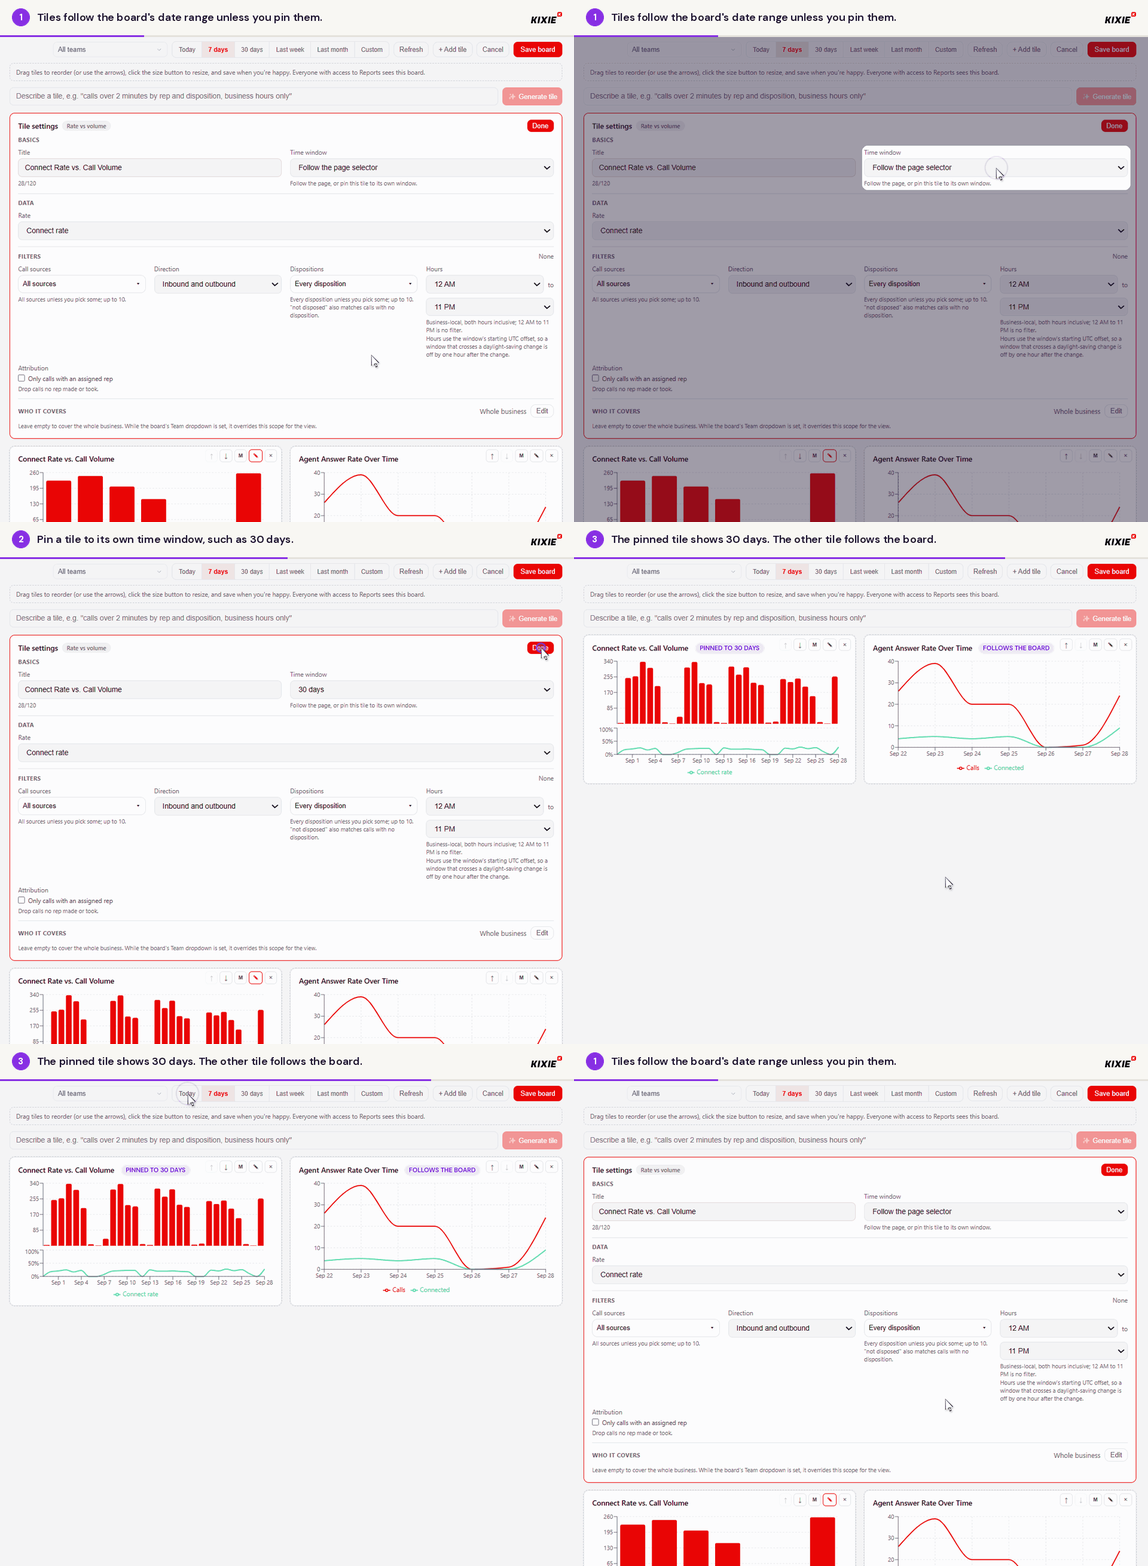
- Tiles follow the dashboard's date range unless you pin them.
- Pin a tile to its own time window, such as 30 days.
- The pinned tile shows 30 days. The other tile follows the dashboard.
- Switch the dashboard to Today, and only the following tile changes.
Try this: pin one connect rate report to 30 days and leave a second on the dashboard's date range. Change the dates and only the second one moves, so you always see the current period against your baseline.
6. Arrange the dashboard to read your way
- In edit mode, drag a report to move it, or use the arrows on the report.
- Click the size button on a report to make it small, medium or full width.
- Click Save board. Cancel discards your changes.
7. Get your dashboard by email
Have any dashboard emailed so your managers get it without logging in.
- Open the dashboard and click Schedule, then + Add schedule.
- Under Runs, choose Daily, Weekly or Monthly, then the day, time and time zone.
- Turn on Email and add recipients, separated by commas.
- Set the Window each email covers, such as Last 7 days, and pick the language.
- Optional: tick Send only when there were calls in the window to skip empty emails.
- Click Save schedules.
Animation: Get a dashboard by email (16 seconds, loops)
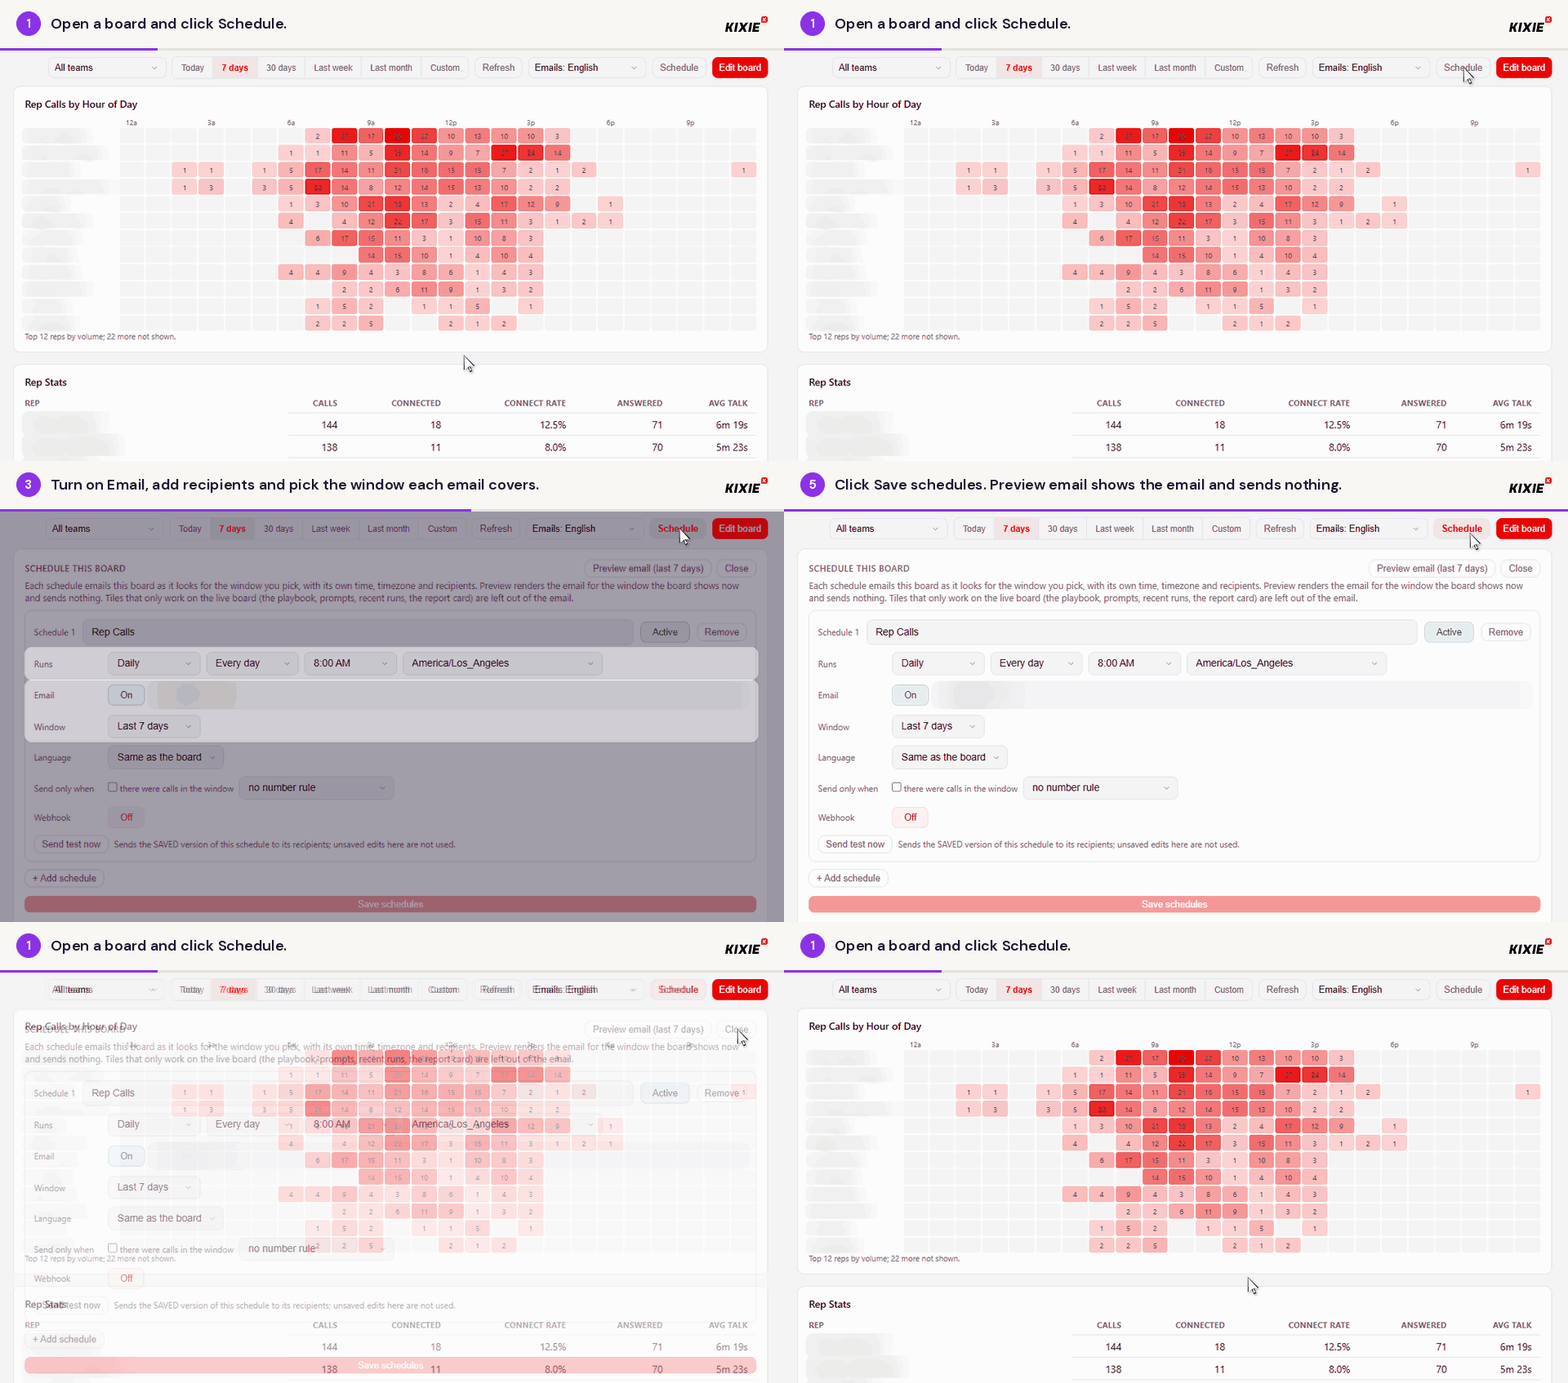
- Open a dashboard and click Schedule.
- Choose how often it's emailed, the time and your time zone.
- Turn on Email, add recipients and pick the window each email covers.
- Optional: send only when there were calls, or send the data to a webhook.
- Click Save schedules. Preview email shows the email and sends nothing.
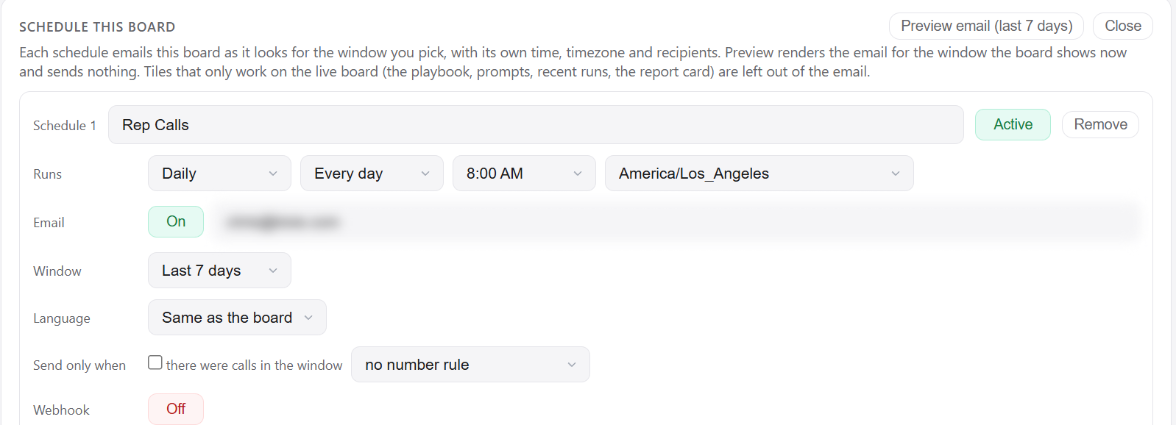
Email settings: frequency, time zone, recipients, window, language and webhook.
A dashboard can have more than one email set up, for example a daily one for team leads and a weekly one for leadership. Each email links back to the live dashboard.
8. Send your dashboard to another system
- Open the dashboard, click Schedule, and add or open an email setup.
- Turn Webhook on and enter the URL of the receiving system, such as a BI tool.
- Click Save schedules. Each send posts the dashboard's data to that URL.
9. Check the email before and after it sends
- Open the dashboard and click Schedule.
- Click Preview email to see the email for the current window. Nothing is sent.
- Click Send test now to send the saved version to its recipients.
- Under Recent runs, open one to see the exact email that went out.
Reports that only work on the live dashboard, such as the Playbook insights and Quick prompts tiles, are left out of the email.
10. Rename or delete a dashboard
- In Reports, click Boards and find the dashboard under Your boards.
- Click Rename, or the trash icon to delete it.
11. Quick tips
- One question per dashboard. A dashboard that answers "how is the SDR team connecting this week" gets read.
- Give each manager their own dashboard for their team, and have it emailed on Monday morning.
- Use Hours to measure connect and answer rates during business hours only.
- Filter to PowerDialer calls in Call sources to see how list-based outreach is converting.
- Put the report you care about most at the top. That's what people see first in the email.
12. Troubleshooting
Create board is unavailable. Your business has reached 40 dashboards. Delete one you no longer use.
A report doesn't change when I change the dates. It is pinned to its own time window. Open its Tile settings and set Time window back to Follow the page selector.
A report shows a different team than I set. When the dashboard's team dropdown is set to a team, it overrides the report's Who it covers for that view. Set the dropdown to All teams.
The email didn't arrive. Check that Email is on and the recipients are right, check spam, then open Recent runs to confirm it was sent. If Send only when is ticked and there were no calls, nothing is sent.
Get started
Open Reports in the Kixie AI Dashboard and build your first dashboard. If you want help setting it up, contact your Kixie account team or support@kixie.com.