
See how your team is calling, texting and dialing, all on one screen. The Reports page in the Kixie AI Dashboard opens on your Business snapshot, and the reports you run every week are already built into ready-made dashboards that need no setup.
Where to find it: go to ai.kixie.com, sign in with your Kixie account and click Reports in the left sidebar. Business snapshot is the Snapshot tab, which opens first. For a closer look, open the Boards tab.
This article includes a short animation and a video tour. Names, email addresses and call totals are blurred.
What you get
- Reports. A report is one measure of your business, such as connect rate, a leaderboard or a call trend. Each report appears as a tile.
- Dashboards. A dashboard is a collection of reports on one page. You'll find them on the Boards tab, grouped around one area of your business, such as call outcomes or rep performance.
- Business snapshot. Your most important reports from across the ready-made dashboards, on one page. See what every Snapshot number means.
- Ready-made dashboards. Dashboards already built for the reports teams run most.
- Your dashboards. Dashboards you and your team build yourselves, shared across your business. See Kixie AI Dashboard | How to build reports and dashboards.
- Your full history. Every report filters by team and date range and goes back as far as your account's call history, not just the last 90 days.
Who can see what: admins and managers see the whole company. Everyone else sees their own calls and texts.
In this article
- Watch the 90-second tour
- See your team at a glance
- Know what every Snapshot number means
- Start from a ready-made dashboard
- Pick the right dashboard for the question
- Find a dashboard your team built
- Export your call history
- Quick tips
- Troubleshooting
1. Watch the 90-second tour
A quick look at Business snapshot, filters and date ranges, ready-made dashboards, building a report in plain words and getting a dashboard emailed to you automatically.
2. See your team at a glance
Business snapshot brings the most useful reports from the ready-made dashboards onto one live page.
- Click Reports in the left sidebar. The Snapshot tab opens first.
- Open the team dropdown (it reads All teams) and pick a team.
- Pick a date range: Today, 7 days, 30 days, Last week, Last month or Custom.
- Every report updates together. The key numbers also show how much they changed against the previous period of the same length.
Animation: Switch dates and teams on Snapshot (12 seconds, loops)
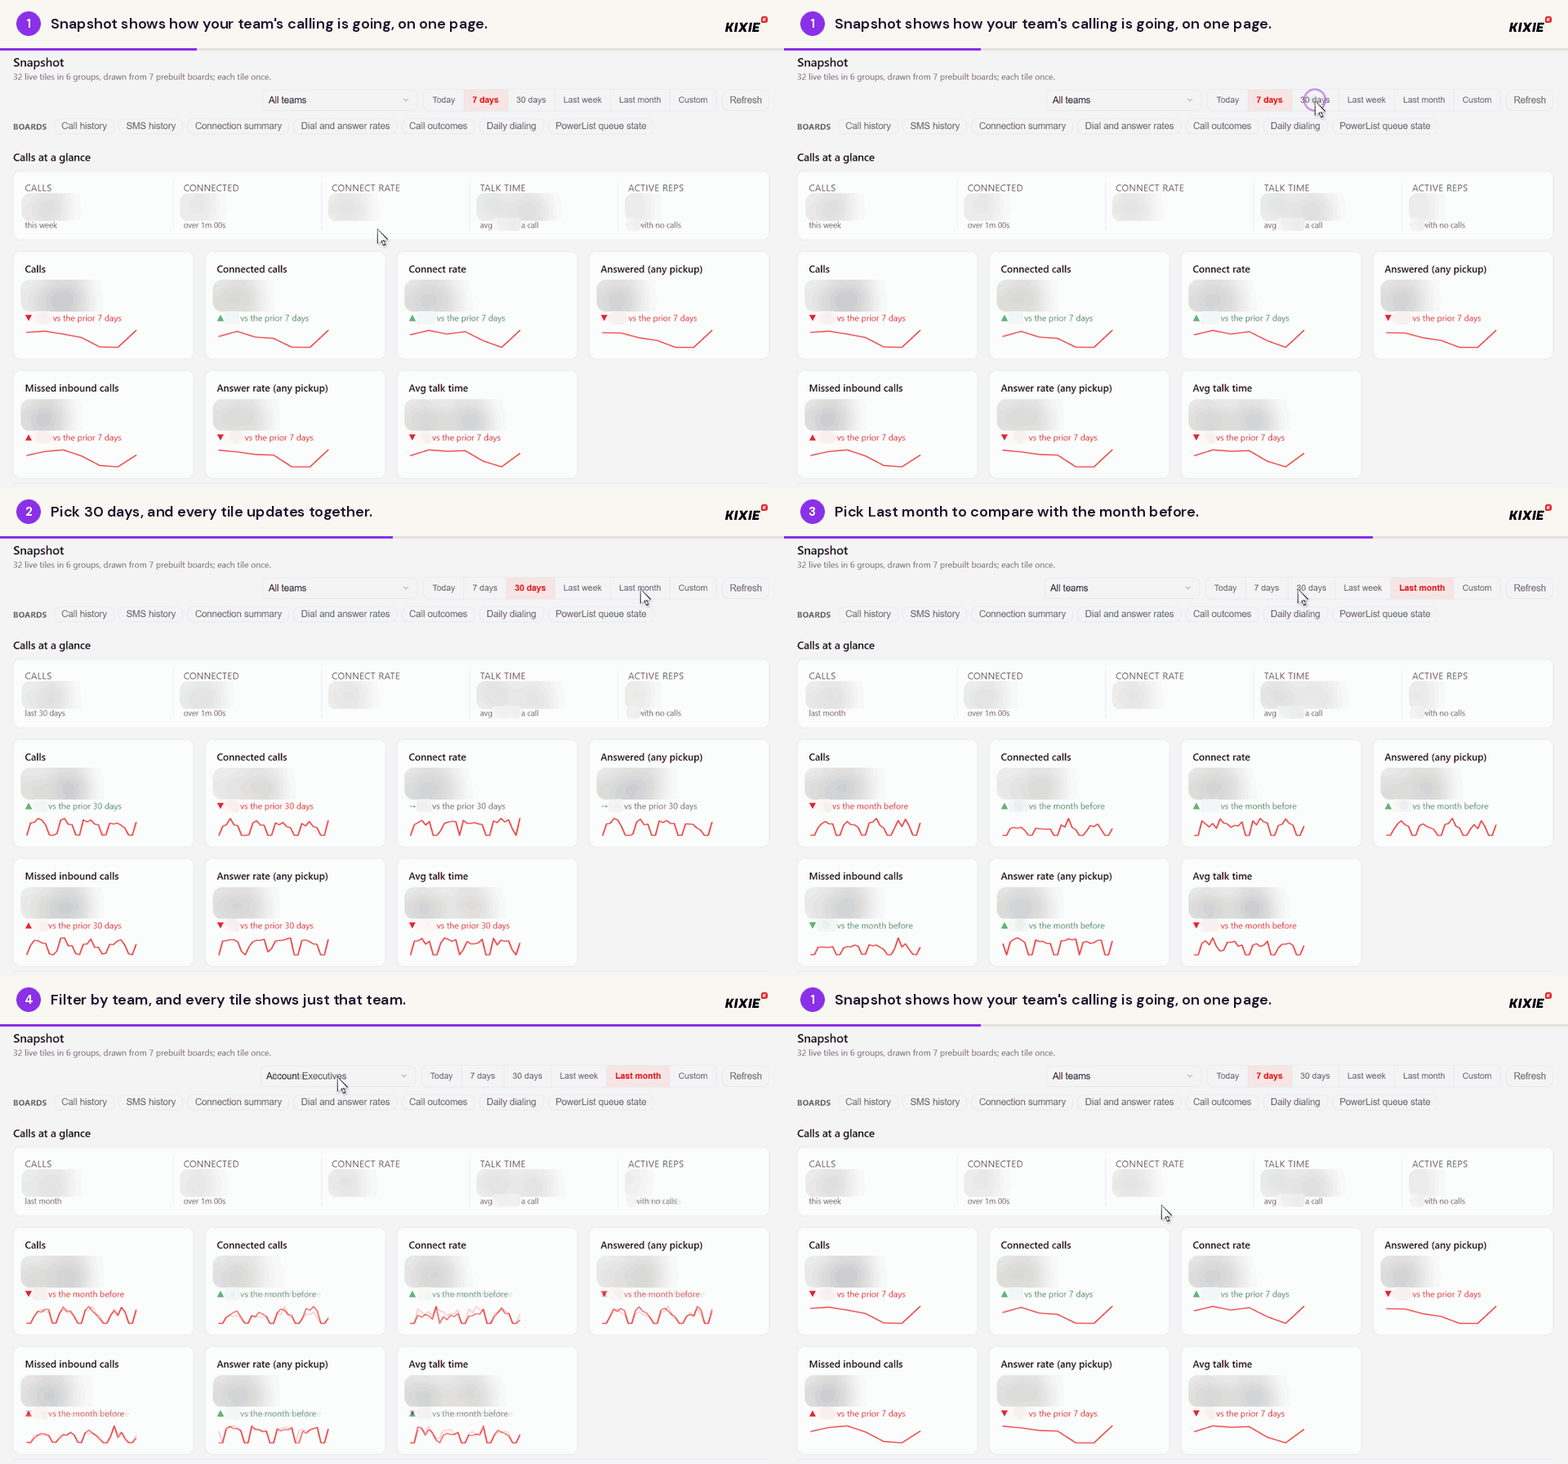
- Snapshot shows how your team's calling is going, on one page.
- Pick 30 days, and every tile updates together.
- Pick Last month to compare with the month before.
- Filter by team, and every tile shows just that team.
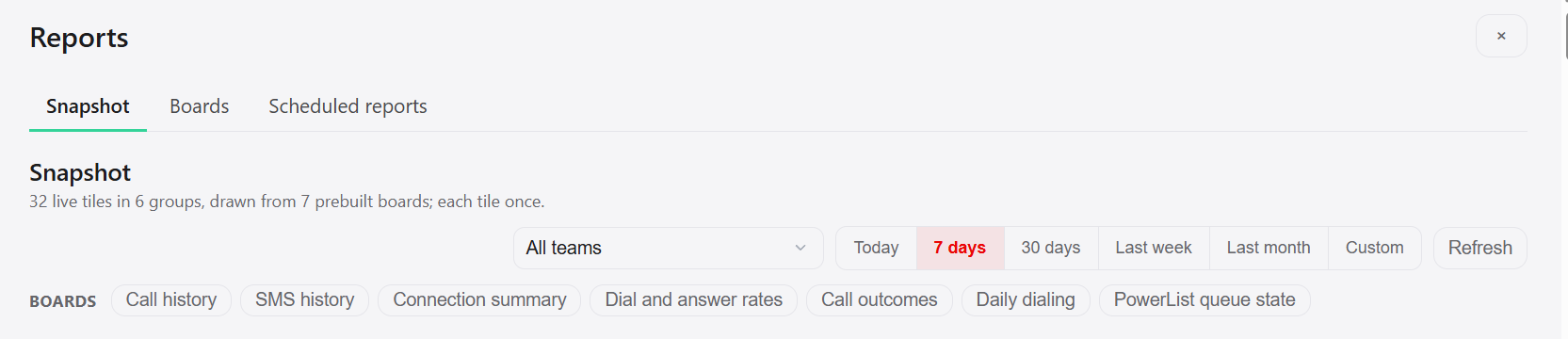
The top of Snapshot: team, date range and shortcuts to the dashboard behind each group of reports.
Good to know: a Custom date range can go back as far as your account's call history, not just the last 90 days.
3. Know what every Snapshot number means
Snapshot groups its reports into six areas. Every report follows the team and date range you pick at the top.
| Group | Report | What it measures |
|---|---|---|
| Calls at a glance | Calls | Every call your team made or took in the period. |
| Connected calls | Calls that lasted more than a minute. | |
| Connect rate | The share of calls that connected. | |
| Answered (any pickup) | Calls that were picked up, however short. | |
| Answer rate (any pickup) | The share of calls that were picked up. | |
| Missed inbound calls | Inbound calls nobody answered. | |
| Talk time and average talk time | Total time on the phone and the average per call. | |
| Active reps | Reps who made or took calls in the period, and how many had none. | |
| Trends | Call trend | Calls and connected calls, day by day. |
| Inbound vs outbound | Daily call volume, split by direction. | |
| Rate vs volume | Connect rate tracked against call volume on one timeline. | |
| Call volume by weekday | Which days of the week your team calls most, over the last 30 days. | |
| Outcomes | Call outcomes | How calls ended, by disposition, as a share of all calls. |
| Sentiment | Analyzed calls split into positive, neutral and negative. | |
| Outcomes by rep | Each rep's dispositions side by side. | |
| Reps | Leaderboard | Reps ranked by calls, connected calls and connect rate. |
| Calls by rep and hour | When each rep is on the phone during the day. | |
| Daily calls by rep | Each rep's call volume, day by day. | |
| PowerDialer | PowerDialer queue | What the PowerDialer is working on right now: queued, dialing, done and held-back contacts. |
| PowerDialer lists (lifetime) | Answer and connect rates for each list since it was created. | |
| Dialer calls and connect rate | PowerDialer call volume and how many of those calls connected. | |
| SMS | SMS sent | Texts your team sent. |
| SMS received | Texts your team received. | |
| SMS delivery rate | The share of sent texts that were delivered. | |
| Unread inbound SMS | Received texts nobody has opened yet. | |
| SMS trend | Texts sent and received, day by day. |
4. Start from a ready-made dashboard
Ready-made dashboards answer the most common questions out of the box. Use one as it is or as a starting point.
- In Reports, click the Boards tab.
- Click any dashboard under Prebuilt boards.
- Use the team and date controls at the top of the dashboard, the same way as on Snapshot.
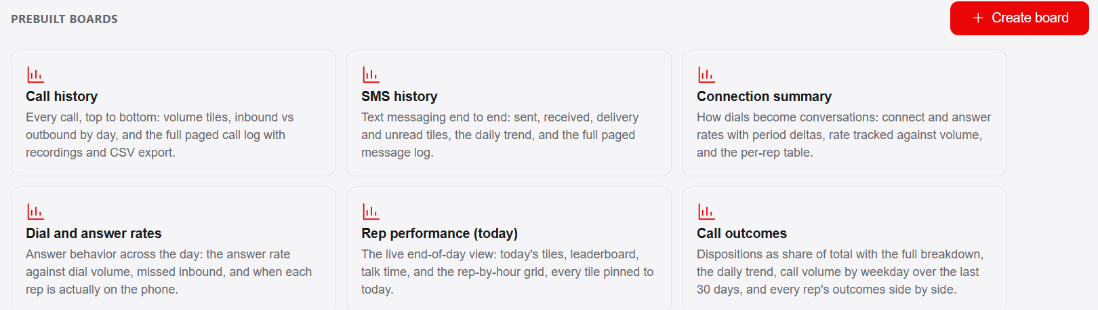
The ready-made dashboards, listed as Prebuilt boards.
Shortcut: the buttons under the Snapshot heading (Call history, SMS history, Connection summary and so on) open the dashboard each group of reports comes from.
5. Pick the right dashboard for the question
| If you want to know | Open this dashboard |
|---|---|
| Every call with its recording, plus a CSV export | Call history |
| Every text sent and received | SMS history |
| How dials turn into conversations | Connection summary |
| When your team answers and when calls get missed | Dial and answer rates |
| How each rep is doing today | Rep performance (today) |
| How calls end, by disposition and by rep | Call outcomes |
| Volume, connects and sentiment in one view | Call activity |
| Who is leading and which calls are worth a second listen | Team performance |
| Who dialed how much, day by day | Daily dialing |
| What the PowerDialer is working on right now | PowerList queue state |
| How last week compared, complete and final | Weekly calling effort |
| Something none of these cover | Blank board, then add reports one at a time |
6. Find a dashboard your team built
- In Reports, click the Boards tab.
- Scroll to Your boards, or type the dashboard's name in Search boards.
- Click Open. Dashboards that are emailed automatically carry a Scheduled label.
7. Export your call history
- Open the Call history dashboard.
- Set the date range on the call log, as far back as you need.
- Click Export CSV. The file downloads straight to your browser.
Good to know: each export holds up to 50,000 rows. For very large exports, split them into several shorter date ranges.
8. Quick tips
- Start the week on Snapshot with Last week selected to see how the team finished.
- Pick a team before you read rep reports. A manager looking at one team gets a much cleaner leaderboard.
- Use Weekly calling effort for Monday reviews. It shows last week complete, so the numbers don't change while you read them.
- When a Snapshot number surprises you, click the shortcut button for that group to open the dashboard behind it.
9. Troubleshooting
I don't see company-wide numbers. Company-wide reporting is for admins and managers. Everyone else sees their own calls and texts.
My numbers differ from the Calls page. Reports count every call your business made, including very short calls and voicemails. The Calls page focuses on analyzed calls, which are calls with enough conversation to score. Compare the same set of calls before comparing numbers.
Get started
Open Reports in the Kixie AI Dashboard and pick Last week on Snapshot. When you're ready for your own view, build a dashboard. If you want help setting it up, contact your Kixie account team or support@kixie.com.